

Model, Analyze, and Understand Complex Global Issues — Intuitively
Causemos™ empowers analysts to access and integrate information from high fidelity sources – both qualitative and quantitative – and seamlessly generate evidence-based insights using a single platform.
In four AI-powered analytic spaces, users can produce custom indexes, interrogate vast datasets, run expert-created models, and quickly uncover knowledge from thousands of documents.
Causemos™ streamlines the process of accessing, collecting, and merging evidence on a given line of inquiry. Produced analyses support focused, meaningful decision-making on subjects of national interest and global impact.
Emerging Use Cases

Food Insecurity Indexing
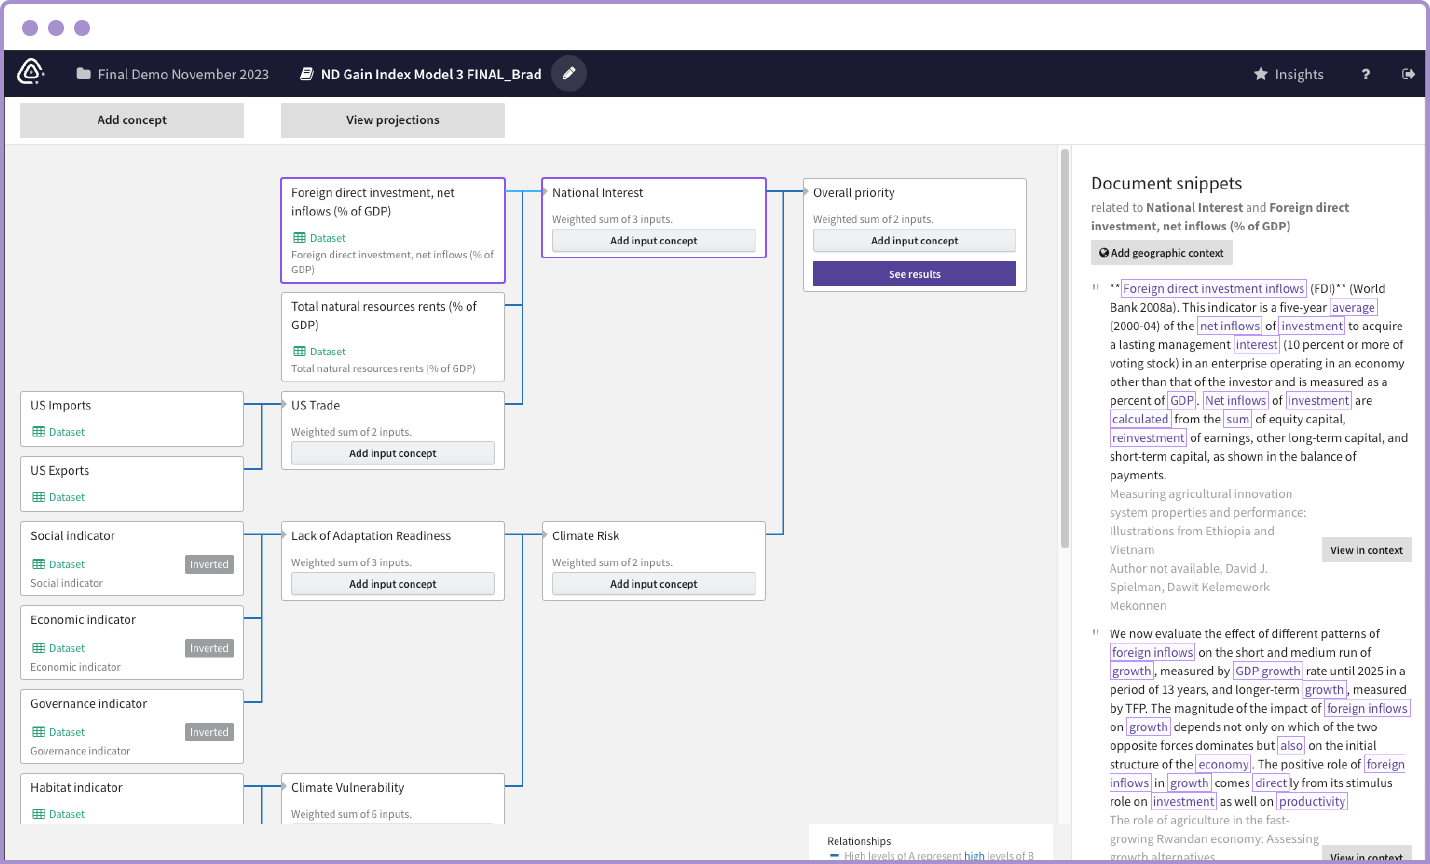
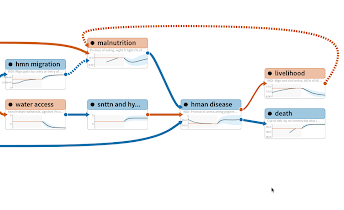
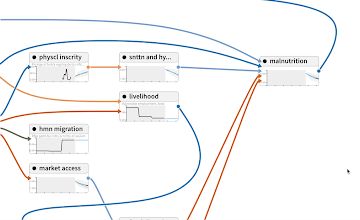
Causemos™ enables analysts to develop an index model — a composite measure of variables or concepts — of global, socio-economic phenomena such as food insecurity.
Analysts can map issues with causal drivers – such as drought, pestilence, or conflict – to create a visual map of a complex problem. Concepts can then be independently weighted and grounded in scientific research using AI-surfaced datasets and literature.
Grounded concepts flow into an index list with transparent rankings which can be further interrogated for sensitivity to change based on adjusted concept weights and datasets from new sources.
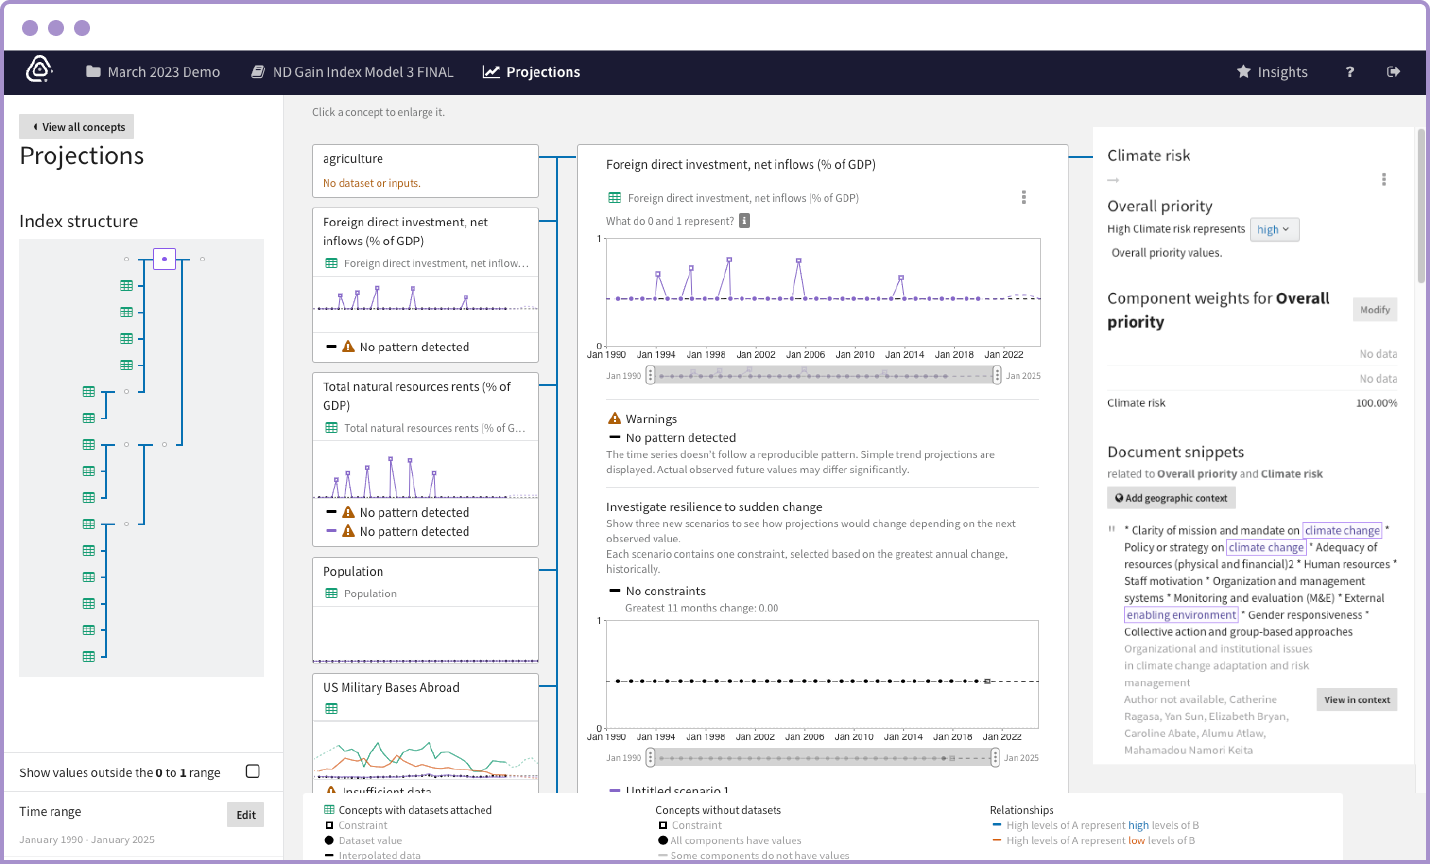
Climate Risk Modeling
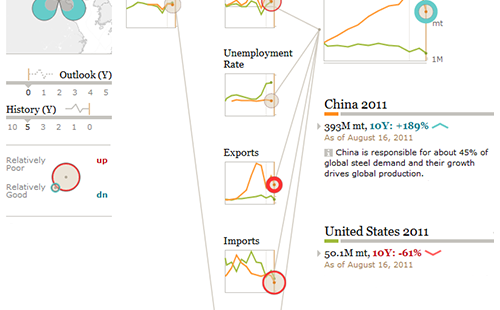
Causemos™ enables analysts to create an index model made of other indexes and datasets, with transparent data normalization and aggregation methods. Index results can be interrogated to understand country rankings, which can direct further investigation and guide analysts to data-driven interventions.
This workflow can disambiguate drivers behind climate related events (aging infrastructure, unusually high temperatures, weak governance) and ground them in data.

Model Complex Relationships for Indexing
Create a custom visual index that generates a ranked list of countries by chosen social, economic, environmental, or other measurements.
Understand which factors contribute most to a country’s ranking. Adjust concept weights and update datasets to identify how the ranked list might be sensitive to change.
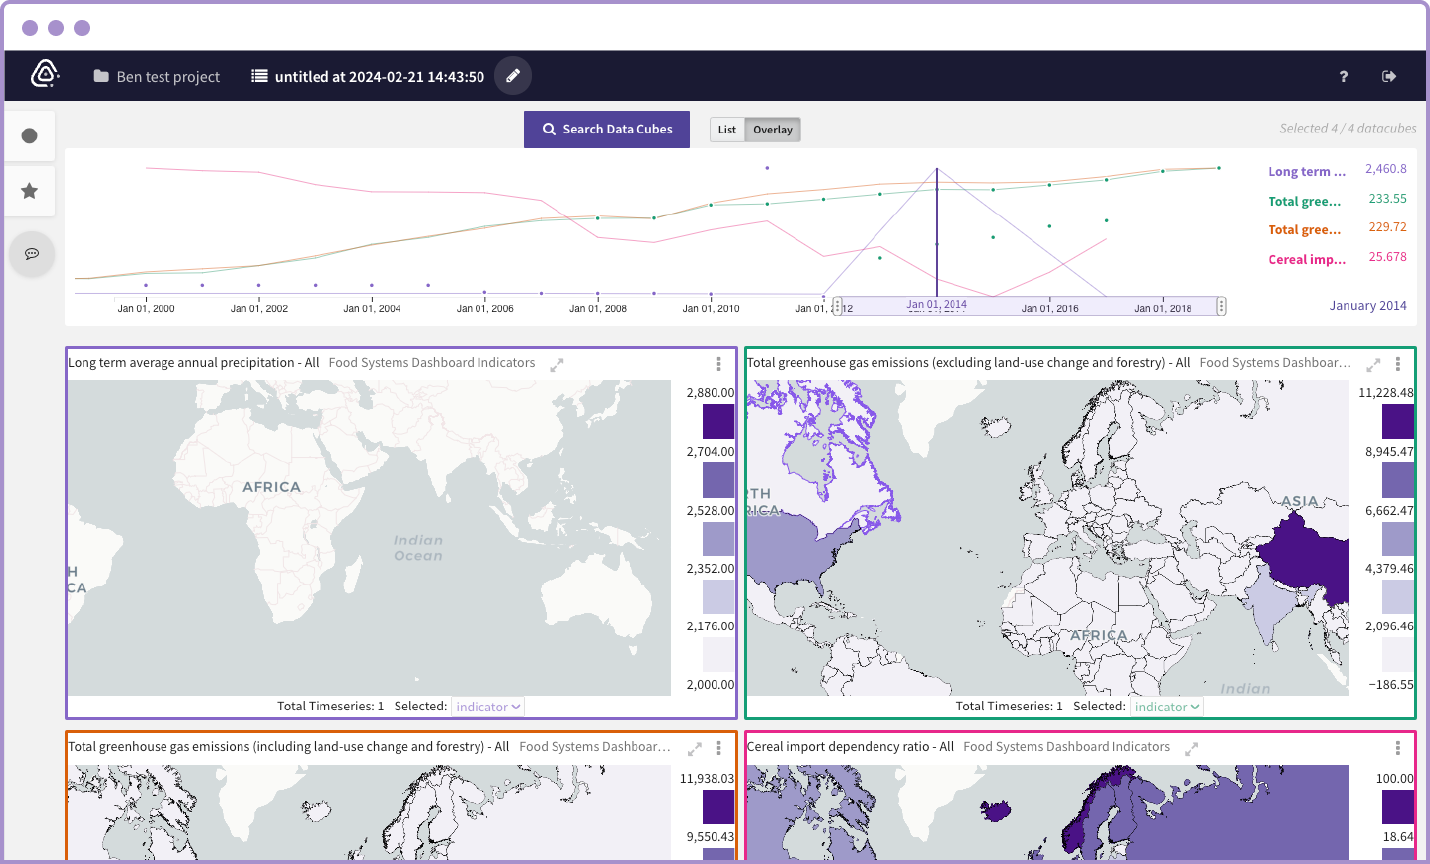
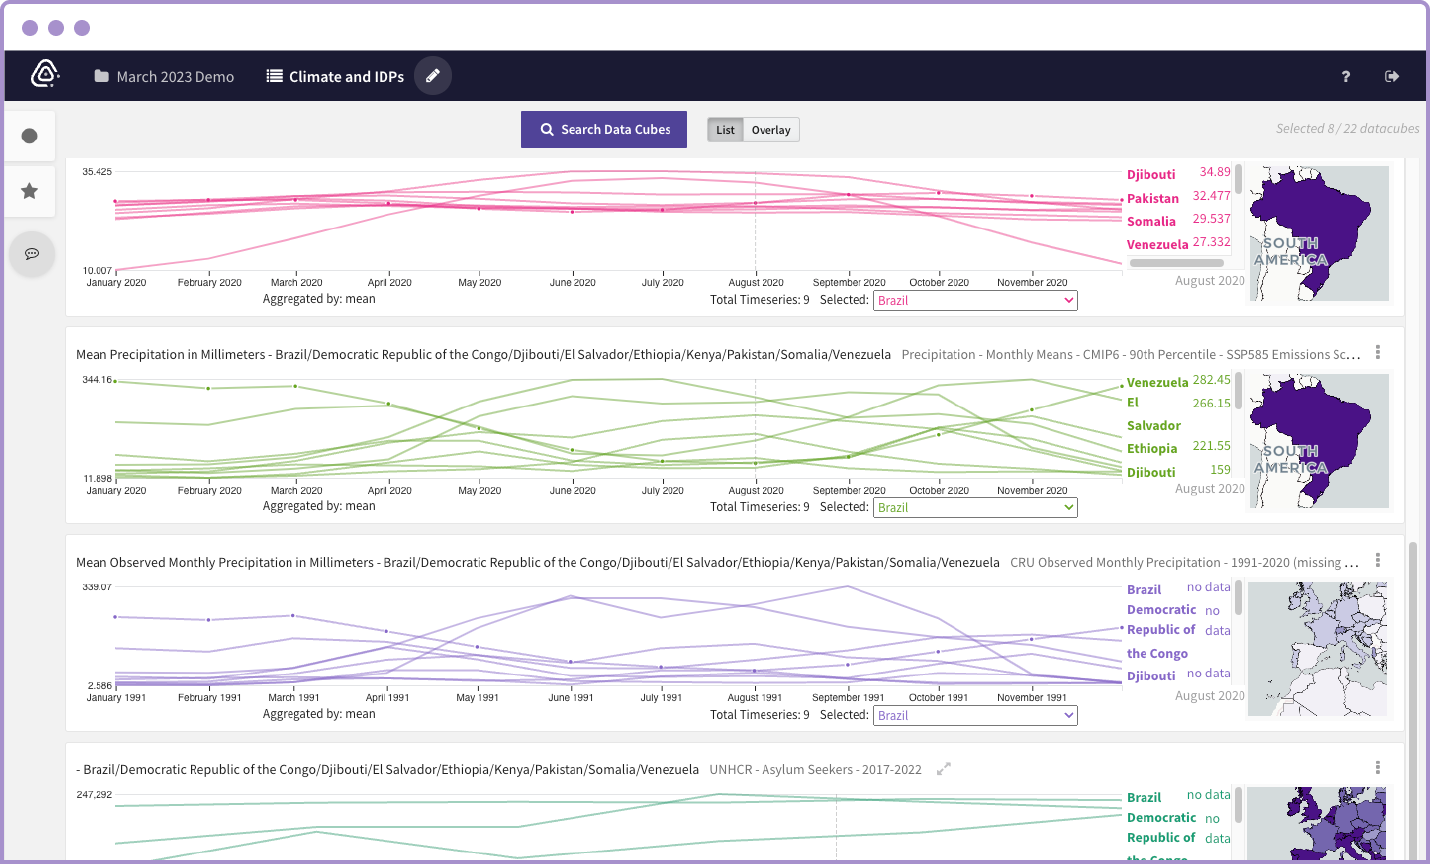
Interrogate and Compare Data
Streamline data-driven decisions and confirm hypotheses by analyzing and comparing disparate datasets.
Enhance targeted insights by assessing datasets for best fit to index models or visualizing data differences to uncover spatial and temporal trends.
Access and Adapt Expert Models
Gain an understanding of real-world phenomena through sophisticated, expertly created models for conducting high-fidelity simulations.
Modify parameters, observe outcomes, and compare models to develop responsive planning.
Inform policy and planning by leveraging expert insights and analyzing multiple model runs concurrently to thoroughly navigate complex systems.
Harness Documents for Rich Insights
Go beyond simple keywords with powerful semantic searches across organization-wide data collections for deeper evidence discovery and context.
Quickly access and analyze relevant AI-surfaced document sections to integrate findings into broader analyses.
Publications
A Mixed-Initiative Visual Analytics Approach for Qualitative Causal Modeling
Modeling complex systems is a time-consuming, difficult and fragmented task, often requiring the analyst to work with disparate data, a variety of models, and expert knowledge across a diverse set of domains. Applying a user-centered design process, we developed a mixed-initiative visual analytics approach, a subset of the Causemos™ platform, that allows analysts to rapidly assemble qualitative causal models of complex socio-natural systems.
Towards a Paradigm for Visual Modeling
Visualization has recently gained a foothold in the field of artificial intelligence research. Typically, this work has focused on visualizing modules or specific dynamics of machine learning models, doing so for the purposes of model explainability or for visual debugging. Drawing from ongoing projects involving pandemic analysis and famine shocks, this seminar describes research efforts on graphical modeling where visualization functions as the medium for modeling itself.
Challenges in Visualizing Complex Causality Characteristics
Causality is important for providing explanations when using computational models to understand complex systems structure and behavior, and what happens when change occurs in the system. There are many properties of causality that need to be considered and made visible, but current causality visualization methods are limited in expressions, scale, dimensionality and do not provide sufficient support for user tasks such as “what-if” and “how-to” questions, or in supporting groups considering multiple scenarios.
Contact Us to Learn More

Uncharted Software
Makers of Causemos™
Uncharted® is a leading provider of innovative visual analytics software solutions for Fortune 500 companies, federal government agencies, and third party software firms. Makers of Causemos™, TellFinder® and other products, we believe that better visual expressions and more intelligent human-machine workflows can have a profound impact on people's ability to discover, understand, and create value from insights in large amounts of complex data.

Software by

Copyright © 2026 Uncharted Software Inc. All Rights Reserved. Uncharted®, TellFinder®, and Causemos™ are trademarks or registered trademarks of Uncharted Software Inc. All other trademarks are the property of their respective owners.